Conditions
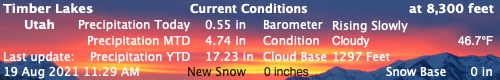
Current Weather
Hover your mouse over each gauge to see a graph of the past 24 hours.
These weather gauges are carefully mounted on heavy duty stainless steel plate. If you need to clean them, use a damp, soft cloth. Do not attempt to remove the gauges as this will void your warranty and likely ruin your monitor. Also do not tap on a gauge to correct its reading; that is only a gimmick used in movies to warn you that something is about to explode. Tapping on one of these gauges will only preserve your fingerprints on your monitor. If you are a movie star, tapping may result in an explosion.
For more information about these gauges and what they display, ==> Click Here.
Today
Weather Station Software Uptime (Days:Hours:Minutes):
Tonight’s weather forecast: Dark. Continued dark overnight, with widely scattered light by morning. (George Carlin, 1937-2008)
Today’s weather fact:
For this month’s lunar calendar, keep on scrolling down.
Forecast
WeatherCam
The numbers in parentheses indicate the change in readings from the previous hour.

Records
The records listed here are only for dates after August 12, 2013.
Highest recorded temperature: 87.4 °F on Jul 15, 2014
Lowest recorded temperature: -14.0 °F on Dec 31, 2014
Total recorded temperature range: 101.4 °F
Highest recorded pressure: 31.31 inHg on Dec 9, 2013
Lowest recorded pressure: 29.25 inHg on Apr 26, 2014
Total recorded pressure range: 2.06 inHg
Highest recorded wind speed: 41.0 MPH on Dec 21, 2014
Wettest day on record: Sep 27, 2014 with 1.94 in of rain.
Snowiest day on record: Dec 25, 2014 with 11 in of snow.
Sunniest day on record: Jun 29, 2014 with 12.2 hours of sunshine.
Most recent day on record: Today
Next likely day on record: Tomorrow
Weather Statistics
These numbers are updated periodically, when the webmaster remembers.
Statistics as of 7:39 AM 14-May-2015
Temperature (°F) (Maximum)
Jan Feb Mar Apr May June July Aug Sept Oct Nov Dec Annual Av.
2015 53.6 55.6 59.3 63.9 64.2 - - - - - - - 59.32
2014 44.1 46.5 51.5 58.3 74.2 75.8 87.4 78.7 75.6 63.9 57.5 46.7 63.35
2013 - - - - - - - 79.7 76.8 63.9 55.5 45.7 64.32
Av: 48.8 51.1 55.4 61.1 69.2 75.8 87.4 79.2 76.2 63.9 56.5 46.2 62.33
Temperature (°F) (Minimum)
Jan Feb Mar Apr May June July Aug Sept Oct Nov Dec Annual Av.
2015 -1.2 1.5 4.1 9.4 26.8 - - - - - - - 8.12
2014 3.5 -1.3 4.3 10.5 19.6 26.3 36.4 35.5 30.7 21.9 -3.5 -14.0 14.16
2013 - - - - - - - 45.6 20.6 16.2 8.8 -13.2 15.60
Av: 1.2 0.1 4.2 9.9 23.2 26.3 36.4 40.6 25.7 19.0 2.7 -13.6 12.63
Temperature (°F) (Average)
Jan Feb Mar Apr May June July Aug Sept Oct Nov Dec Annual Av.
2015 26.7 29.0 35.0 37.4 44.2 - - - - - - - 34.44
2014 22.3 25.8 30.1 35.3 46.9 54.6 64.0 56.6 53.8 43.9 28.8 24.4 40.55
2013 - - - - - - - 61.1 51.5 37.2 30.7 19.0 39.88
Av: 24.5 27.4 32.5 36.4 45.6 54.6 64.0 58.8 52.7 40.6 29.7 21.7 38.29
Heating Degree Days
Jan Feb Mar Apr May June July Aug Sept Oct Nov Dec Annual Tot.
2015 1187 1008 925 829 278 - - - - - - - 4227
2014 1323 1098 1079 890 567 342 148 288 358 653 1084 1259 9088
2013 - - - - - - - 115 416 863 1030 1427 3851
Av: 1255 1053 1002 859 422 342 148 201 387 758 1057 1343 5722
Cooling Degree Days
Jan Feb Mar Apr May June July Aug Sept Oct Nov Dec Annual Tot.
2015 0 0 0 0 0 - - - - - - - 0
2014 0 0 0 0 7 29 116 29 24 0 0 0 205
2013 - - - - - - - 42 12 0 0 0 54
Av: 0 0 0 0 3 29 116 35 18 0 0 0 86
Frost Days
Jan Feb Mar Apr May June July Aug Sept Oct Nov Dec Annual Tot.
2015 30 27 26 24 3 - - - - - - - 110
2014 31 27 31 23 9 3 0 0 1 11 26 29 191
2013 - - - - - - - 0 5 22 30 31 88
Av: 31 27 29 24 6 3 0 0 3 17 28 30 130
Windchill (°F) (Maximum)
Jan Feb Mar Apr May June July Aug Sept Oct Nov Dec Annual Av.
2015 53.6 55.3 59.0 63.9 64.2 - - - - - - - 59.21
2014 44.1 46.5 51.5 58.3 74.2 75.8 87.4 78.7 75.6 63.9 57.4 45.6 63.25
2013 - - - - - - - 79.7 76.8 63.9 55.5 45.7 64.32
Av: 48.8 50.9 55.2 61.1 69.2 75.8 87.4 79.2 76.2 63.9 56.5 45.7 62.26
Windchill (°F) (Minimum)
Jan Feb Mar Apr May June July Aug Sept Oct Nov Dec Annual Av.
2015 -17.9 -6.1 -10.8 -2.7 19.0 - - - - - - - -3.72
2014 -3.6 -5.1 -2.9 6.4 14.8 26.3 33.9 29.3 26.1 12.6 -12.9 -25.5 8.28
2013 - - - - - - - 45.0 19.3 13.6 5.1 -19.6 12.69
Av: -10.8 -5.6 -6.9 1.8 16.9 26.3 33.9 37.2 22.7 13.1 -3.9 -22.5 5.75
Windchill (°F) (Average)
Jan Feb Mar Apr May June July Aug Sept Oct Nov Dec Annual Av.
2015 21.9 24.6 30.8 34.0 42.2 - - - - - - - 30.70
2014 21.0 25.0 28.6 33.9 46.2 54.3 63.8 55.8 52.7 41.1 24.2 19.4 38.83
2013 - - - - - - - 61.1 51.5 36.5 29.6 17.8 39.29
Av: 21.4 24.8 29.7 34.0 44.2 54.3 63.8 58.4 52.1 38.8 26.9 18.6 36.27
Heat Index(°F) (Maximum)
Jan Feb Mar Apr May June July Aug Sept Oct Nov Dec Annual Av.
2015 53.6 55.6 59.3 63.9 64.2 - - - - - - - 59.32
2014 44.1 46.5 51.5 58.3 74.2 75.8 87.4 78.7 75.6 63.9 57.5 46.7 63.35
2013 - - - - - - - 79.7 76.8 63.9 55.5 45.7 64.32
Av: 48.8 51.1 55.4 61.1 69.2 75.8 87.4 79.2 76.2 63.9 56.5 46.2 62.33
Heat Index(°F) (Average)
Jan Feb Mar Apr May June July Aug Sept Oct Nov Dec Annual Av.
2015 26.7 29.0 35.0 37.4 44.2 - - - - - - - 34.44
2014 22.3 25.8 30.1 35.3 46.9 54.6 64.0 56.6 53.8 43.9 28.8 24.4 40.55
2013 - - - - - - - 61.1 51.5 37.2 30.7 19.0 39.88
Av: 24.5 27.4 32.5 36.4 45.6 54.6 64.0 58.8 52.7 40.6 29.7 21.7 38.29
Wind Speed (MPH) (Maximum)
Jan Feb Mar Apr May June July Aug Sept Oct Nov Dec Annual Av.
2015 24.0 27.0 30.0 35.0 34.0 - - - - - - - 30.00
2014 20.0 22.0 30.0 23.0 27.0 22.0 30.0 27.0 30.0 33.0 41.0 41.0 28.83
2013 - - - - - - - 18.0 21.0 31.0 17.0 23.0 22.00
Av: 22.0 24.5 30.0 29.0 30.5 22.0 30.0 22.5 25.5 32.0 29.0 32.0 26.94
Wind Speed (MPH) (Average)
Jan Feb Mar Apr May June July Aug Sept Oct Nov Dec Annual Av.
2015 4.5 4.5 5.1 4.7 4.4 - - - - - - - 4.64
2014 1.5 1.3 1.9 2.4 2.7 2.4 3.1 4.1 4.2 5.2 4.7 4.8 3.19
2013 - - - - - - - 1.4 1.2 1.7 1.7 1.3 1.44
Av: 3.0 2.9 3.5 3.5 3.6 2.4 3.1 2.8 2.7 3.4 3.2 3.0 3.09
Wind Direction (Degrees) (Average)
Jan Feb Mar Apr May June July Aug Sept Oct Nov Dec Annual Av.
2015 206 214 207 212 194 - - - - - - - 206.7
2014 188 184 188 192 166 173 179 177 184 197 220 203 187.5
2013 - - - - - - - 142 154 173 175 186 166.0
Av: 197 199 197 202 180 173 179 159 169 185 197 195 186.7
Wind Run(Miles)
Jan Feb Mar Apr May June July Aug Sept Oct Nov Dec Annual Tot.
2015 3258.5 2931.2 3783.1 3364.0 1366.9 - - - - - - - 14703.6
2014 1056.9 858.8 1426.5 1715.0 1970.3 1669.4 2297.3 2974.3 2945.8 3832.5 3327.8 3519.1 27593.7
2013 - - - - - - - 634.8 823.6 1203.5 1169.7 938.3 4769.8
Av: 2157.7 1895.0 2604.8 2539.5 1668.6 1669.4 2297.3 1804.6 1884.7 2518.0 2248.7 2228.7 15689.1
Pressure (inHg) (Maximum)
Jan Feb Mar Apr May June July Aug Sept Oct Nov Dec Annual Av.
2015 30.78 30.57 30.72 30.54 30.13 - - - - - - - 30.55
2014 31.20 30.74 30.66 30.54 30.51 30.16 30.00 30.15 30.12 30.40 30.83 30.88 30.51
2013 - - - - - - - 30.35 30.69 30.87 30.94 31.31 30.83
Av: 30.99 30.65 30.69 30.54 30.32 30.16 30.00 30.25 30.40 30.64 30.89 31.09 30.63
Pressure (inHg) (Minimum)
Jan Feb Mar Apr May June July Aug Sept Oct Nov Dec Annual Av.
2015 29.91 29.79 29.57 29.41 29.55 - - - - - - - 29.65
2014 29.97 29.47 29.30 29.25 29.32 29.39 29.58 29.56 29.52 29.66 29.41 29.43 29.49
2013 - - - - - - - 29.94 29.63 29.64 29.83 29.74 29.76
Av: 29.94 29.63 29.43 29.33 29.43 29.39 29.58 29.75 29.57 29.65 29.62 29.59 29.63
Pressure (inHg) (Average)
Jan Feb Mar Apr May June July Aug Sept Oct Nov Dec Annual Av.
2015 30.33 30.16 30.14 29.90 29.76 - - - - - - - 30.06
2014 30.63 30.22 30.02 29.91 29.78 29.73 29.79 29.85 29.84 30.01 30.17 30.17 30.01
2013 - - - - - - - 30.12 30.10 30.31 30.46 30.62 30.32
Av: 30.48 30.19 30.08 29.90 29.77 29.73 29.79 29.98 29.97 30.16 30.32 30.40 30.13
Precipitation (in) (Total)
Jan Feb Mar Apr May June July Aug Sept Oct Nov Dec Annual Tot.
2015 0.73 1.17 0.99 1.73 2.15 - - - - - - - 6.77
2014 0.26 1.27 2.56 1.94 0.74 0.55 2.17 3.84 5.01 0.31 1.38 2.19 22.22
2013 - - - - - - - 1.75 2.53 1.27 0.92 0.34 6.81
Av: 0.49 1.22 1.77 1.83 1.44 0.55 2.17 2.79 3.77 0.79 1.15 1.26 11.93
Rain Days (>0.00 in)
Jan Feb Mar Apr May June July Aug Sept Oct Nov Dec Annual Tot.
2015 12 10 6 11 8 - - - - - - - 47
2014 12 12 21 17 9 4 7 16 10 5 10 15 138
2013 - - - - - - - 11 16 15 12 11 65
Av: 12 11 14 14 9 4 7 14 13 10 11 13 83
Snow (in) (Total)
Jan Feb Mar Apr May June July Aug Sept Oct Nov Dec Annual Tot.
2015 9.5 17.5 11.5 20.0 4.5 - - - - - - - 63.0
2014 23.0 37.0 32.0 20.0 2.0 4.0 0.0 0.0 0.0 0.0 22.0 38.0 178.0
2013 - - - - - - - - - - - - 0.0
Av: 16.2 27.2 21.8 20.0 3.2 4.0 0.0 0.0 0.0 0.0 22.0 38.0 120.5
Snow Days
Jan Feb Mar Apr May June July Aug Sept Oct Nov Dec Annual Tot.
2015 7 5 6 9 2 - - - - - - - 29
2014 4 11 13 8 2 1 0 0 0 0 8 11 58
2013 - - - - - - - - - - - - 0
Av: 6 8 10 9 2 1 0 0 0 0 8 11 44
Solar Radiation(W/m^2) (Maximum)
Jan Feb Mar Apr May June July Aug Sept Oct Nov Dec Annual Av.
2015 580 1085 1027 1281 1246 - - - - - - - 1043.80
2014 - - - - - 1248 1306 1160 1060 932 682 608 999.43
2013 - - - - - - - - - - - - -
Av: 580 1085 1027 1281 1246 1248 1306 1160 1060 932 682 608 1021.61
Solar Radiation(W/m^2) (Average)
Jan Feb Mar Apr May June July Aug Sept Oct Nov Dec Annual Av.
2015 45.7 104.0 168.6 176.9 164.5 - - - - - - - 131.96
2014 - - - - - 269.6 250.4 188.6 166.5 138.3 49.8 26.4 155.67
2013 - - - - - - - - - - - - -
Av: 45.7 104.0 168.6 176.9 164.5 269.6 250.4 188.6 166.5 138.3 49.8 26.4 143.81
Sunshine hours (Total)
Jan Feb Mar Apr May June July Aug Sept Oct Nov Dec Annual Tot.
2015 49.7 135.8 225.3 236.2 95.7 - - - - - - - 742.7
2014 - - - - - 309.6 299.1 224.9 195.2 206.5 76.5 24.1 1336.1
2013 - - - - - - - - - - - - -
Av: 49.7 135.8 225.3 236.2 95.7 309.6 299.1 224.9 195.2 206.5 76.5 24.1 1039.4
U.V. Index (Maximum)
Jan Feb Mar Apr May June July Aug Sept Oct Nov Dec Annual Av.
2015 3.5 6.0 8.2 9.3 9.5 - - - - - - - 7.30
2014 - - - - - 10.7 12.1 11.8 9.7 6.5 4.4 2.8 8.29
2013 - - - - - - - - - - - - -
Av: 3.5 6.0 8.2 9.3 9.5 10.7 12.1 11.8 9.7 6.5 4.4 2.8 7.79
U.V. Index (Average)
Jan Feb Mar Apr May June July Aug Sept Oct Nov Dec Annual Av.
2015 0.3 0.7 1.3 1.3 1.3 - - - - - - - 0.98
2014 - - - - - 2.2 2.3 1.8 1.5 1.1 0.3 0.2 1.34
2013 - - - - - - - - - - - - -
Av: 0.3 0.7 1.3 1.3 1.3 2.2 2.3 1.8 1.5 1.1 0.3 0.2 1.16
Windy Days
Jan Feb Mar Apr May June July Aug Sept Oct Nov Dec Annual Tot.
2015 6 8 13 16 9 - - - - - - - 52
2014 1 2 3 4 7 5 7 12 10 14 14 11 90
2013 - - - - - - - 0 3 4 0 1 8
Av: 4 5 8 10 8 5 7 6 7 9 7 6 50
Ice Days
Jan Feb Mar Apr May June July Aug Sept Oct Nov Dec Annual Tot.
2015 10 7 3 1 - - - - - - - - 21
2014 13 11 3 2 - - - - - - 8 14 51
2013 - - - - - - - - - 1 5 18 24
Av: 11 9 3 2 - - - - - 1 6 16 32
Monthly Weather Summary
Summary weather data is provided for the current month. This data is updated periodically, when the webmaster remembers.
NAME: Timber Lakes
ELEV: 8284 Feet

MONTHLY CLIMATOLOGICAL SUMMARY FOR May 2015

                                    TEMPERATURE (°F)  RAIN (in)  WIND SPEED (MPH)

                                                  HEAT     COOL              AVG
       MEAN                                       DEG      DEG               WIND                      DOM
DAY    TEMP    HIGH   TIME      LOW    TIME       DAYS     DAYS     RAIN     SPEED    HIGH    TIME     DIR
-------------------------------------------------------------------------------------------------------------
01     50.8    63.7   15:44     36.3   04:15      14.2      0.0     0.00      5.3     21.0    14:31    S
02     54.2    64.2   14:40     42.8   04:45      10.8      0.0     0.00      4.6     21.0    17:19    SSW
03     50.0    63.1   15:18     38.3   06:56      15.0      0.0     0.03      5.6     21.0    21:36    S
04     46.4    57.3   11:22     39.7   06:25      18.6      0.0     0.00      4.7     24.0    17:06    SSE
05     44.6    52.4   13:48     39.0   22:40      20.4      0.0     0.78      2.7     16.0    21:50    SSW
06     41.6    48.9   14:14     36.5   20:45      23.4      0.0     0.42      2.4     19.0    20:46    SW
07     40.2    51.3   14:15     34.3   00:00      24.8      0.0     0.16      5.3     29.0    16:37    SSE
08     40.2    50.3   14:40     33.3   04:08      24.8      0.0     0.04      4.3     33.0    17:10    S
09     33.3    36.3   08:58     30.8   23:30      31.7      0.0     0.66      1.8     14.0    02:45    WNW
10     34.1    41.3   15:40     29.7   06:05      30.9      0.0     0.05      2.6     22.0    16:52    W
11     42.1    55.7   15:09     26.8   03:41      22.9      0.0     0.00      7.4     29.0    19:13    SE
12     48.6    59.6   13:17     41.6   23:24      16.4      0.0     0.01      6.9     34.0    14:01    SSE
13     49.1    58.0   17:09     41.6   04:03      15.9      0.0     0.00      4.1     19.0    17:20    S
14     41.1    43.8   00:01     38.9   03:00       8.0      0.0     0.00      3.9     10.0    03:07    SSE
-------------------------------------------------------------------------------------------------------------
       44.0    64.2     2       26.8    11       277.7      0.0     2.15      4.4     34.0     12      S

Max >=  75.0:  0
Max <=  32.0:  0
Min <=  32.0:  3
Min <=  -0.0:  0
Max Rain:   0.78 ON 05/05/15
Days of Rain: 7 (>.01 in) 4 (>.1 in) 0 (>1 in)
Heat Base:   65.0  Cool Base:   65.0
Annual Weather Summary
Summary weather data is provided for previous years.
NAME: Timber Lakes
ELEV: 8284 Feet

ANNUAL CLIMATOLOGICAL SUMMARY FOR 2015
NAME: Creekside
ELEV: 8284.0 Feet  LAT: 040° 27' 40" N  LONG: -111° -13' -42" W

                    TEMPERATURE (°F), HEAT BASE 65.0, COOL BASE 65.0

                          DEP  HEAT  COOL
       MEAN  MEAN        FROM  DEG   DEG                        MAX  MAX  MIN  MIN
YR MO  MAX   MIN   MEAN  NORM  DAYS  DAYS  HI  DATE  LOW  DATE  >=75 <=32 <=32 <=0
-----------------------------------------------------------------------------------
15  1  35.6  18.5  26.7   2.2  1187     0  53.6  26  -1.2   22    0   10   30    1
15  2  38.7  19.9  29.0   1.6  1008     0  55.6  14   1.5   23    0    7   27    0
15  3  47.3  24.2  35.0   2.5   925     0  59.3  30   4.1    5    0    2   26    0
15  4  48.0  26.8  37.4   1.0   829     0  63.9  29   9.4    3    0    1   24    0
15  5  53.3  36.4  44.0  -1.5   278     0  64.2   2  26.8   11    0    0    3    0
15  6
15  7
15  8
15  9
15 10
15 11
15 12
-----------------------------------------------------------------------------------
       44.6  25.2  34.4   1.1  4227     0  64.2   5  26.8    5    0   20  110    1


                                       PRECIPITATION (in)

               DEP.   MAX        DAYS OF RAIN
               FROM   OBS.           OVER
YR MO  TOTAL   NORM   DAY  DATE  .01  .1   1
---------------------------------------------
15  1   0.73   0.23   0.26   12    8   3   0
15  2   1.17  -0.05   0.45   21    7   3   0
15  3   0.99  -0.79   0.37    2    6   4   0
15  4   1.73  -0.10   0.45   25    9   6   0
15  5   2.15   0.70   0.78    5    7   4   0
15  6
15  7
15  8
15  9
15 10
15 11
15 12
---------------------------------------------
        6.77  -0.00   0.78    5   37  20   0


                                       WIND SPEED (MPH)

                        DOM
YR MO  AVG.  HI   DATE  DIR
----------------------------
15  1  4.4  24.0   16   SSW
15  2  4.5  27.0   20   SW
15  3  5.2  30.0   31   SSW
15  4  4.7  35.0   14   SSW
15  5  4.4  34.0   12   SSW
15  6
15  7
15  8
15  9
15 10
15 11
15 12
----------------------------
       4.6  35.0    4   SSW

ANNUAL CLIMATOLOGICAL SUMMARY FOR 2014

                    TEMPERATURE (°F), HEAT BASE 65.0, COOL BASE 65.0

                          DEP  HEAT  COOL
       MEAN  MEAN        FROM  DEG   DEG                        MAX  MAX  MIN  MIN
YR MO  MAX   MIN   MEAN  NORM  DAYS  DAYS  HI  DATE  LOW  DATE  >=75 <=32 <=32 <=0
-----------------------------------------------------------------------------------
14  1  32.8  13.6  22.3  -2.2  1323     0  44.1  19   3.5    4    0   13   31    0
14  2  32.9  17.2  25.8  -4.0  1098     0  46.5  26  -1.3    2    0   11   27    2
14  3  40.1  20.0  30.1   0.0  1091     0  51.5  25   4.3   19    0    3   31    0
14  4  45.2  24.9  35.3   0.0   878     0  58.3  21  10.5   14    0    2   23    0
14  5  58.0  36.0  46.9  -0.0   553     7  74.2  28  19.6   13    0    0    9    0
14  6  67.3  40.9  54.6   0.0   340    31  75.8  24  26.3   18    2    0    3    0
14  7  77.0  51.9  64.0   0.0   145   115  87.4  15  36.4    1   21    0    0    0
14  8  68.3  46.6  56.6  -2.2   295    28  78.7  18  35.5   23    4    0    0    0
14  9  66.2  43.7  53.9   1.2   374    24  75.6  17  30.7   12    1    0    1    0
14 10  56.4  33.7  43.9   3.4   645     0  63.9  14  21.9   28    0    0   11    0
14 11  37.9  19.6  28.8  -0.9  1098     0  57.5   6  -3.5   16    0    8   26    1
14 12  31.7  16.8  24.4   2.7  1260     0  46.7  10 -14.0   31    0   14   29    4
-----------------------------------------------------------------------------------
       51.2  30.4  40.6  -0.2  9100   205  87.4   7 -14.0   12   28   51  191    7

                                       PRECIPITATION (in)

               DEP.   MAX        DAYS OF RAIN
               FROM   OBS.           OVER
YR MO  TOTAL   NORM   DAY  DATE  .01  .1   1
---------------------------------------------
14  1   0.26  -0.24   0.05   18    6   0   0
14  2   1.27   0.39   0.31   14    8   5   0
14  3   2.56   0.00   0.33   12   18  11   0
14  4   1.94   0.00   0.24   26   16   9   0
14  5   0.74  -0.00   0.26   23    8   3   0
14  6   0.55   0.00   0.36   18    4   2   0
14  7   2.17  -0.00   0.90   10    7   6   0
14  8   3.84   1.04   0.76   23   14  11   0
14  9   5.01   1.24   1.90   27    9   9   2
14 10   0.31  -0.48   0.13   12    4   1   0
14 11   1.38   0.23   0.36   15    9   4   0
14 12   2.19   0.92   0.61   21   13   6   0
---------------------------------------------
       22.22   0.10   1.90    9  116  67   2

                                       WIND SPEED (MPH)

                        DOM
YR MO  AVG.  HI   DATE  DIR
----------------------------
14  1  1.5  20.0    9   S
14  2  1.3  22.0   19   S
14  3  1.9  30.0   30   S
14  4  2.4  23.0   13   SSW
14  5  2.7  27.0   11   SSE
14  6  2.4  22.0   15   S
14  7  3.1  30.0   20   S
14  8  4.1  27.0   18   S
14  9  4.2  30.0    6   S
14 10  5.2  33.0   31   SSW
14 11  4.7  41.0    1   SW
14 12  4.8  41.0   12   SSW
----------------------------
       3.2  41.0   11   S

ANNUAL CLIMATOLOGICAL SUMMARY FOR 2013

                    TEMPERATURE (°F), HEAT BASE 65.0, COOL BASE 65.0

                          DEP  HEAT  COOL
       MEAN  MEAN        FROM  DEG   DEG                        MAX  MAX  MIN  MIN
YR MO  MAX   MIN   MEAN  NORM  DAYS  DAYS  HI  DATE  LOW  DATE  >=75 <=32 <=32 <=0
-----------------------------------------------------------------------------------
13  1
13  2
13  3
13  4
13  5
13  6
13  7
13  8  72.8  51.1  61.3   2.4   120    43  79.7  15  45.6   24   10    0    0    0
13  9  61.8  42.4  51.5  -1.2   426    11  76.8   4  20.6   28    2    0    5    0
13 10  47.6  28.7  37.2  -3.4   880     0  63.9   7  16.2   16    0    1   22    0
13 11  40.5  21.9  30.7   0.9  1037     0  55.5  12   8.8    4    0    5   30    0
13 12  28.0  10.2  19.0  -2.7  1427     0  45.7  18 -13.2    5    0   18   31    6
-----------------------------------------------------------------------------------
       50.1  30.9  39.9  -0.8  3889    54  79.7   8 -13.2   12   12   24   88    6


                                       PRECIPITATION (in)

               DEP.   MAX        DAYS OF RAIN
               FROM   OBS.           OVER
YR MO  TOTAL   NORM   DAY  DATE  .01  .1   1
---------------------------------------------
13  1
13  2
13  3
13  4
13  5
13  6
13  7
13  8   1.75  -1.04   0.49   17   11   5   0
13  9   2.53  -1.24   0.44   26   14   8   0
13 10   1.27   0.48   0.25    5   12   6   0
13 11   0.92  -0.23   0.17   17   10   5   0
13 12   0.34  -0.92   0.07   27    9   0   0
---------------------------------------------
        6.81  -0.09   0.49    8   56  24   0


                                       WIND SPEED (MPH)

                        DOM
YR MO  AVG.  HI   DATE  DIR
----------------------------
13  1
13  2
13  3
13  4
13  5
13  6
13  7
13  8  1.4  18.0   19   SE
13  9  1.2  21.0   21   SSE
13 10  1.7  31.0   28   S
13 11  1.7  17.0    8   S
13 12  1.3  23.0   19   S
----------------------------
       1.4  31.0   10   SSE
Historical Timber Lakes Weather Data
Weather Underground
Click on the WU icon below to leave this website and go to Weather Underground to view historical weather observations for Timber Lakes. WU receives data from the National Weather Service, as well as from more than 100,000 personal weather stations. This data is updated every 2.5 seconds.
PWS
Click on the PWS icon below to leave this website and go to PWS Personal Weather Stations to view historical weather observations for Timber Lakes. PWS is a partnership between HAMweather LLC and weatherforyou.com LLC. This data is updated every 30 minutes.

National Weather Service
Click on the NOAA icon below to leave this website and go to the National Weather Service (NWS) to view weather observations from the past 48 hours for Timber Lakes. The NWS is the official weather organization of the U.S. government (home of the free, land of the brave, etc.).

Weathercloud
Click on the Weathercloud icon below to leave this website and go to Weathercloud to view historical weather observations for Timber Lakes. It is a real-time weather social network formed by more than 4,500 weather observers from around the world. It is based in the European Union, is available in 10 languages, including English and has very nice graphics. This data is updated every 10 minutes.

CoCoRaHS
Click on the CoCoRaHS icon below to leave this website and go to the Community Collaborative Rain, Hail & Snow network to view historical precipitation observations for Timber Lakes. CoCoRaHS is the the largest provider of daily precipitation observations in the United States, contributed by volunteer backyard weather observers. This data is updated every morning.

Met Office
Click on the Met Office icon below to leave this website and go to the Met Office Weather Observation Website to view historical weather observations for Timber Lakes. The Met Office is the official weather organization for the United Kingdom of Great Britain and Northern Ireland. This data is updated every 15 minutes and is best viewed with fish and chips.
![]()
AWEKAS
Click on the AWEKAS icon below to leave this website and go to AWEKAS. AWEKAS stands for Automatisches WEtterKArten System (Automatic Weather Mapping System). It maps weather data from more than 3,600 personal weather stations around the world. It was started in Austria in 2004 and provides data in German, Dutch, French, Italian and English. Data is presented in a colorful graphic display and is updated every 10 minutes.
![]()
Lunar Calendar
About this Weather Station
This page is powered by a Mac®, a lot of hot air and WeatherCat:
History:
- May 2007 – installed Davis Vantage Pro2 personal weather station
- Aug 2013 – installed WeatherCat software version 1
- Sep 2013 – added Weather page to TimberLakesUtah.com
- Oct 2013 – began reporting data to Weather Underground and CWOP
- Nov 2013 – began reporting data to Met Office
- Feb 2014 – began reporting data to PWS
- Apr 2014 – changed the battery in the weather station for the first time in 7 years
- Jun 2014 – replaced old weather station with Davis Vantage Pro2 Plus, which added sensors for solar radiation and ultraviolet light
- Jul 2014 – relocated anemometer to more accurate location for recording wind speed and direction
- Aug 2014 – redesigned the Weather page on TimberLakesUtah.com, adding weather statistics and links to historical data
- Sep 2014 – upgraded software to WeatherCat version 2, begin reporting data to CoCoRaHS, replaced the battery in the weather station again, after only five months – discovered that the solar panel was not reconnected after moving the anemometer in July
- Oct 2014 – added a weather webcam, began reporting data to Weathercloud
- Feb 2015 – upgraded SteelSeries Gauges, added moon information and NOAA-style reports
- Mar 2015 – began reporting data to AWEKAS
Multiple Lot Owners
Disclaimer
THE FINE PRINT: This weather data is generated as a hobby from a personal weather station located on the upper mountain on the east side of Timber Lakes. No one should rely on the accuracy of the data or the forecast. This weather data is provided for gee-whiz purposes only and should not be used as the basis for any travel or recreational decisions. The data has not been verified for accuracy and should not be used as a substitute for good information, good sense, good manners, good taste, good company, good feelings, good grief, good vibes, good food, good times, good looks, good news, good night, good job, goodness sakes, Good Golly Miss Molly, the Good Humor Man, the Good, the Bad and the Ugly, applying sunscreen or wearing a seatbelt while operating a motor vehicle. Any similarity to actual weather is purely coincidental. This data will probably not bruise fruit or frighten small animals away from your cabin. The weather is not covered by, nor responsible for, the Affordable Healthcare Act. Please keep your arms and legs inside your cabin at all times until the weather has come to a complete stop. Not insured by the FDIC. Flying squirrels courtesy of Rocky and Bullwinkle. No animals were harmed during the uploading of this weather information. Side effects from watching the weather gauges on this page may include: headache, nausea, muscular dysfunction, cancer, SARS, baldness, constipation, blue urine, brain failure, unrealistic anticipation of being beamed up by Mr. Scott, dancing teeth, coyote attack, falling rocks, rubber bones, ATVs on your roof, illusions of grandeur, extra weather in your yard, hallucinations of the TLPOA Board wearing tutus, and tearing the fabric of the space-time continuum. Check with a medical professional before spending any significant time on this page. If you are a werewolf, please review lunar information for the date and time of the next full moon. Then stay home. The weather may not be enjoyed by anyone without the express written consent of the United Nations, the United States Government, the Governor of the State of Utah, the Wasatch County Council, the Mayor of Heber City, the National Forest Service, the Rainbow Family of Living Light, both members of the Pro Cycling Tour who are drug free, the Timber Lakes Property Owners Association, Chuck Norris, Mr. Clean, the Chief of Police of Granite Flats, Andy, Barney, Aunt Bee and Opie, Captain Picard, anyone who owns an Apple Watch, someone from Northern Ireland, the United Federation of Planets, the Klingon Empire, Lord Tiberius Skärva the Fourth, the Stay Puft Marshmallow Man and your high school science teacher (good luck finding him – he has probably already been beamed up by Mr. Scott). Weather provided by Mother Nature. Actual weather not included – you have to go outside for that.